





A delayed warehouse dispatch may be recorded in the management system. However, this data often cannot explain where the time was lost: a forklift may have had to wait at an intersection, pallets may have remained in the staging area for too long, or a blocked aisle may have forced workers to take a detour.
This is the gap AI cameras can help address. Instead of using cameras only to review incidents, businesses can analyze footage from their existing CCTV systems to identify recurring patterns of congestion, waiting, and deviations from expected movement flows inside the warehouse.
A Warehouse Bottleneck Is More Than a Single Delay
A forklift stopping for several minutes at an intersection is not enough to conclude that the area has a problem. A bottleneck is usually a recurring pattern: queues repeatedly form at the same location, dwell time in a staging area consistently exceeds the expected threshold, or productivity declines during a particular time window.
Some warning signs include:
-
Pallets or goods remain in the staging area for too long.
-
Forklifts frequently have to queue at warehouse doors or intersections.
-
Aisles are obstructed, forcing people and vehicles to change direction.
-
Dock-door turnover takes longer than planned.
-
Goods flows become imbalanced between different areas or work shifts.
-
Equipment remains idle while a nearby area is continuously overloaded.
-
Vehicles repeatedly deviate from their designated routes.
The purpose of the analysis is not to determine whether an individual moves quickly or slowly, but to understand how the overall process operates within each area. This approach helps businesses focus on improving layouts, schedules, and coordination methods instead of assigning blame based on an isolated video clip.
Why Are WMS or TMS Data Not Enough to Identify the Cause?
WMS, TMS, and YMS platforms can record when a barcode is scanned, a process step is completed, a vehicle arrives at a dock door, or an order leaves the warehouse. This enables businesses to measure actual processing times and identify stages that fail to meet their KPIs.
However, many physical activities between two system events are not recorded. A forklift may have to wait for a clear route, a pallet may be placed in the wrong location, or two workflows may need to use the same aisle at the same time. The system only shows that total processing time has increased, without revealing how much time was consumed by each contributing factor.
When operational data is combined with camera footage, the picture becomes more complete. The management system answers the question, “Which stage is running slowly?”, while AI cameras provide the context needed to investigate, “What is happening there?”
How Do AI Cameras Analyze Bottlenecks?
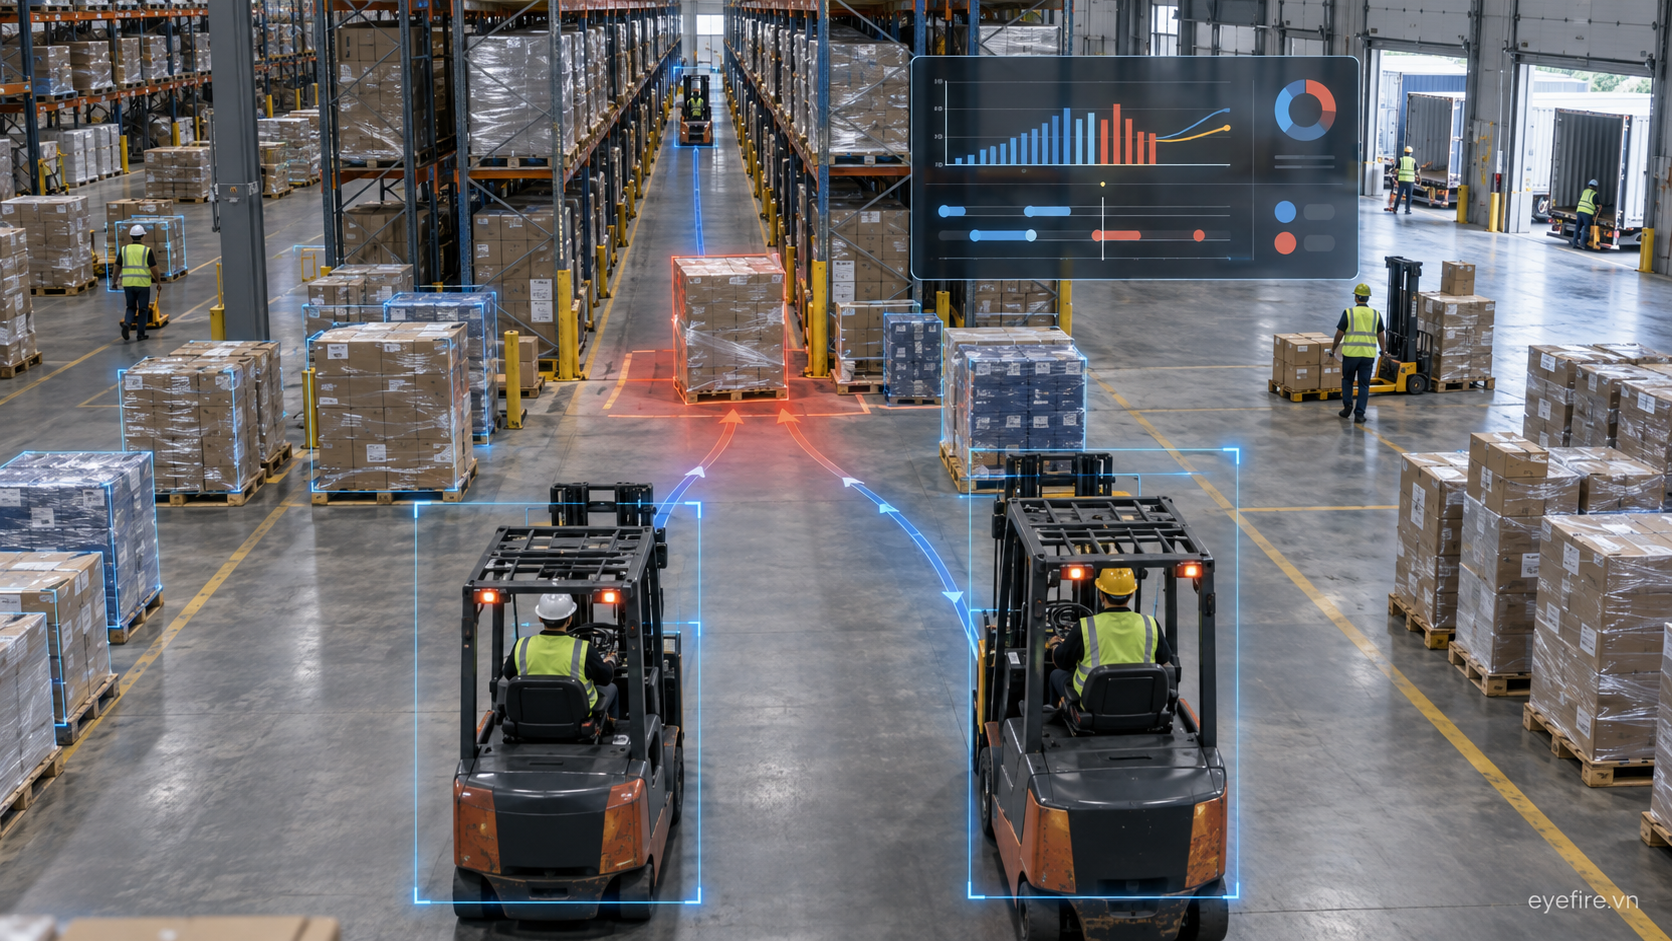
AI cameras can be configured to observe a specific zone within a camera’s field of view, such as an entrance, exit, intersection, aisle, or goods handoff point. From the captured footage, the system analyzes signals including the number of objects in the zone, dwell time, movement direction, density, and the frequency of congestion.
The results should be aggregated by area and time rather than based on a single event. When an abnormal pattern repeatedly appears across representative shifts, the business has a stronger basis for narrowing down possible causes and selecting an improvement measure.
AI cameras do not replace WMS platforms or other existing management systems. Their value lies in adding a visual data layer for physical activities that forms, barcode scans, and system timestamps cannot fully represent.
A Five-Step Process for Finding Bottlenecks Using Existing CCTV
Step 1: Select One Process and One Metric to Improve
Businesses should begin with a limited scope, such as turnaround time at a cluster of receiving doors, the number of pallets staged per hour, or travel time along a main route. A clearly defined metric makes the analysis results measurable and verifiable.
Step 2: Check the Camera’s Field of View
The camera needs a clear view of the area related to the metric being monitored. If the objective is to measure travel time through an aisle, the entry and exit points must fall within an analyzable field of view. Blind spots caused by shelving, lighting conditions, parked vehicles, or the camera’s installation angle must also be checked.
A business does not need to deploy the solution across the entire warehouse from the outset. Starting with one to three high-impact areas is a practical way to validate feasibility and standardize the measurement method.
Step 3: Establish a Baseline Across Multiple Shifts
Data should be collected over a sufficiently representative period, covering regular shifts, peak hours, and days with different levels of activity. A baseline helps distinguish a random incident from a systematic bottleneck.
Possible metrics include average dwell time, travel time through an area, number of queue occurrences, congestion duration, and hourly throughput.
Step 4: Compare the Intended Flow with Actual Movement
The business compares the designed route and processing rhythm with the movement data observed by the cameras. If forklifts frequently detour around the same location, several goods flows converge during the same time window, or the staging area repeatedly reaches capacity before the end of a shift, these are signs that require investigation.
AI camera results can indicate factors that may be contributing to the delay, but a correlation should not immediately be treated as the sole cause. Production plans, workforce availability, equipment condition, and data from management systems should also be considered.
Step 5: Test One Change and Measure It Again Using the Same Metric
After forming a hypothesis, the business should test a clearly scoped change, such as adjusting replenishment schedules, relocating a staging area, changing the direction of traffic, or separating the operating times of two workflows.
The results should then be measured using the same metric and camera coverage used to establish the baseline. A lower frequency of congestion, shorter queues, and reduced travel time are signals that the measure is working. Nearby areas should also be checked to ensure that the bottleneck has not merely shifted to another location.
Areas That Should Be Prioritized for Analysis
Receiving and Dispatch Doors
Queues involving trucks, forklifts, and loading personnel can easily develop in these areas. AI cameras can support the analysis of door occupancy time, waiting periods, and situations in which multiple vehicles gather at the same location.
Staging Areas
Dwell time exceeding the expected threshold may indicate that the next process is not ready, the staging area lacks sufficient capacity, or replenishment activities overlap with outbound staging.
Intersections and Main Aisles
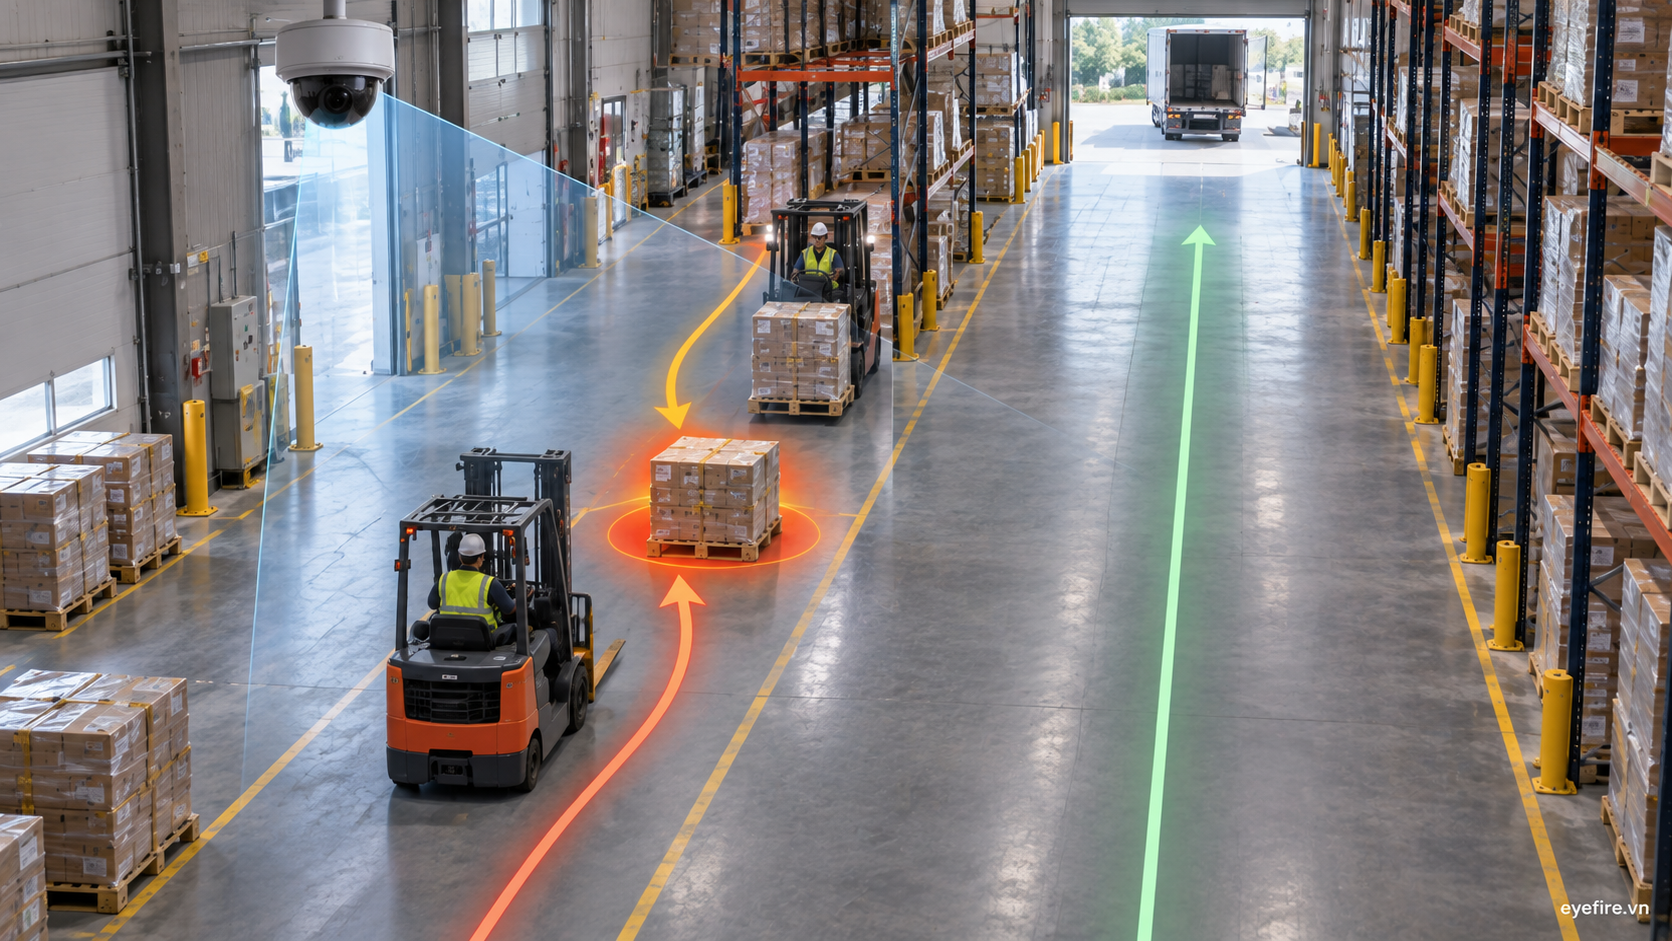
Converging routes do not only affect productivity; they can also increase the risk of collisions between forklifts, pedestrians, and other vehicles. Analyzing density, waiting time, and movement direction helps businesses reconsider lane markings, signs, movement schedules, and route design.
Handoff Points Between Process Stages
At pick-to-pack, pack-to-stage, or stage-to-dispatch handoff points, one process may have to wait for input from the previous stage. Dwell time and the rate at which goods move through these handoff points can reveal imbalances between adjacent processes.
Coordination and Dispatch Areas
Comparing the rate at which goods leave the staging area with the rate at which they are loaded for dispatch helps businesses identify periods when outbound capacity cannot keep pace with warehouse output.
Example: Congestion in a Staging-Area Aisle
Suppose staging productivity regularly decreases between 1:00 p.m. and 3:00 p.m. System data confirms that the number of pallets processed per hour falls below the target, but it does not reveal why.
Analysis of footage from the aisle entrance and the adjacent intersection shows that forklifts frequently have to detour around an obstructed point. During the same period, replenishment and outbound staging activities use the same aisle. This overlap provides a reasonable hypothesis that needs to be tested.
The business could move the replenishment schedule by 30 minutes and then compare throughput, travel time, and congestion frequency again. If goods flow improves without creating a new bottleneck, the change can be standardized or applied to similar areas.
Optimizing Efficiency Without Separating It from Safety
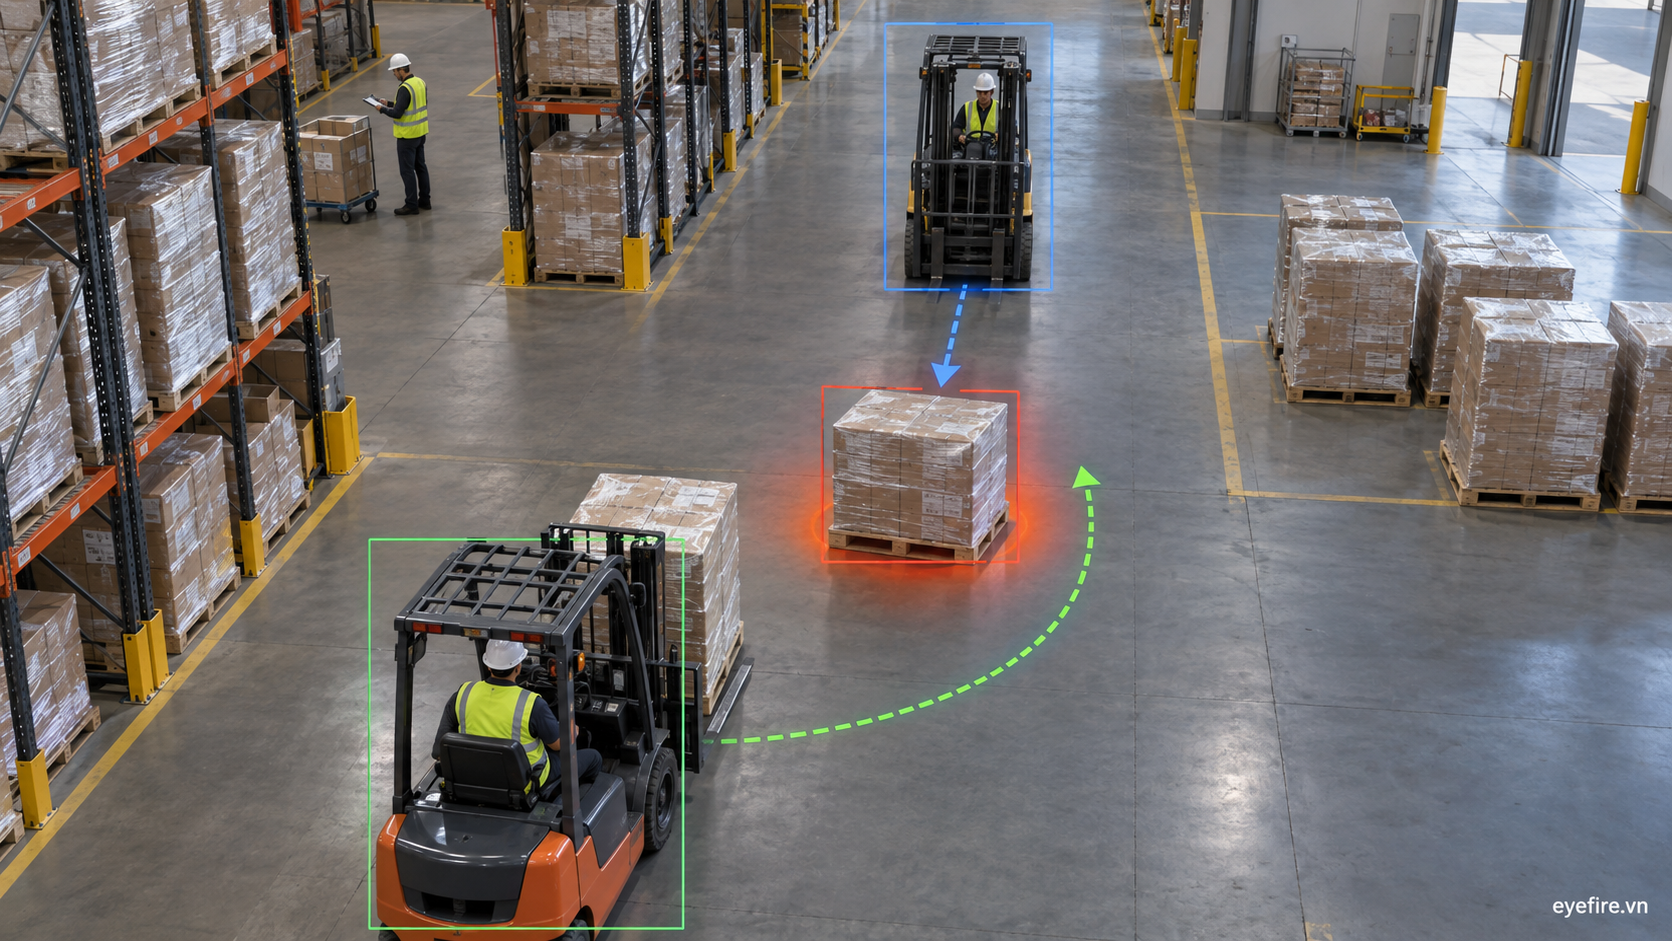
Bottlenecks and safety risks often arise in the same locations. Busy intersections, obstructed aisles, and overloaded staging areas increase waiting time while also reducing safe clearance and visibility.
Businesses should therefore avoid focusing only on increasing movement speed. A change should be considered effective when it improves throughput while maintaining the separation of people and vehicles, safe distances, escape routes, and visibility within the area.
With its Vision AI platform, EyeFire helps businesses use cameras as a source of operational data: monitoring defined areas, detecting events according to configured conditions, and aggregating information for assessment. Depending on the existing infrastructure and actual use case, the solution can be configured for priority areas without requiring the entire camera system to be replaced from the beginning.
Points to Consider Before Deployment
Analysis quality depends on the viewing angle, lighting, occlusion, and stability of the video stream. Businesses need to survey the existing camera system to determine which cameras can be reused, which need to be repositioned, and where additional equipment may be required.
Alongside technical requirements, the purpose of data processing, retention scope, access rights, and privacy policies must be clearly defined. Analysis should focus on area-level trends and process improvement, rather than turning the system into a tool for evaluating individuals without sufficient context.
Turning Cameras from Review Tools into Operational Improvement Data
Warehouse bottlenecks do not always appear in reports. Many minutes of waiting occur between barcode scans, at intersections, inside aisles, and at handoff points that operational systems cannot observe.
By combining operational metrics with CCTV data, businesses can identify patterns of delay, validate possible causes, and measure the effectiveness of each change. A suitable approach is to start with one important workflow, one trusted metric, and a few high-impact camera zones, then expand based on actual results.
EyeFire helps businesses gradually upgrade their existing surveillance systems into tools for proactive management, supporting safer and more efficient warehouse environments.